
Performance Optimization: Lessons from Google’s Legends
Reading the performance optimization playbook from two of the most influential engineers in computing.

If you’ve worked in distributed systems or backend infrastructure, you’ve almost certainly come across Jeff Dean and Sanjay Ghemawat. Together, they co-created MapReduce and Bigtable, two foundational systems that shaped modern large-scale data processing. Jeff Dean later went on to co-author Spanner and lead major efforts behind TensorFlow, extending that lineage into globally consistent databases and large-scale machine learning.
Recently, they published a comprehensive guide on performance optimization, and it’s a goldmine. Let us extract the core principles that can transform how you think about performance.
The 3% That Matters
Knuth famously said “premature optimization is the root of all evil.” But here’s the full quote most people miss:
“We should forget about small efficiencies, say about 97% of the time: premature optimization is the root of all evil. Yet we should not pass up our opportunities in that critical 3%.“
The key insight? If you ignore performance entirely during development, you’ll end up with a flat profile—performance lost everywhere, no obvious hotspots. Much harder to fix later.
Why “Fix It Later” Fails
Flat profiles are hell to optimize - No clear starting point when slowness is distributed everywhere
Library users can’t fix your mess - They don’t understand your internals well enough
Heavy-use systems resist change - Hard to refactor production code serving millions of requests
Overprovisioning masks problems - You throw hardware at issues that could’ve been prevented with better code
The golden rule: When writing code, choose the faster alternative if it doesn’t significantly hurt readability.
The Art of Estimation
Before diving into optimization, develop intuition for what matters. Ask yourself:
Is it test code? → Focus on asymptotic complexity only
Is it application-specific? → Identify hot paths vs. initialization code
Is it library code? → Assume it’ll be used in performance-critical contexts
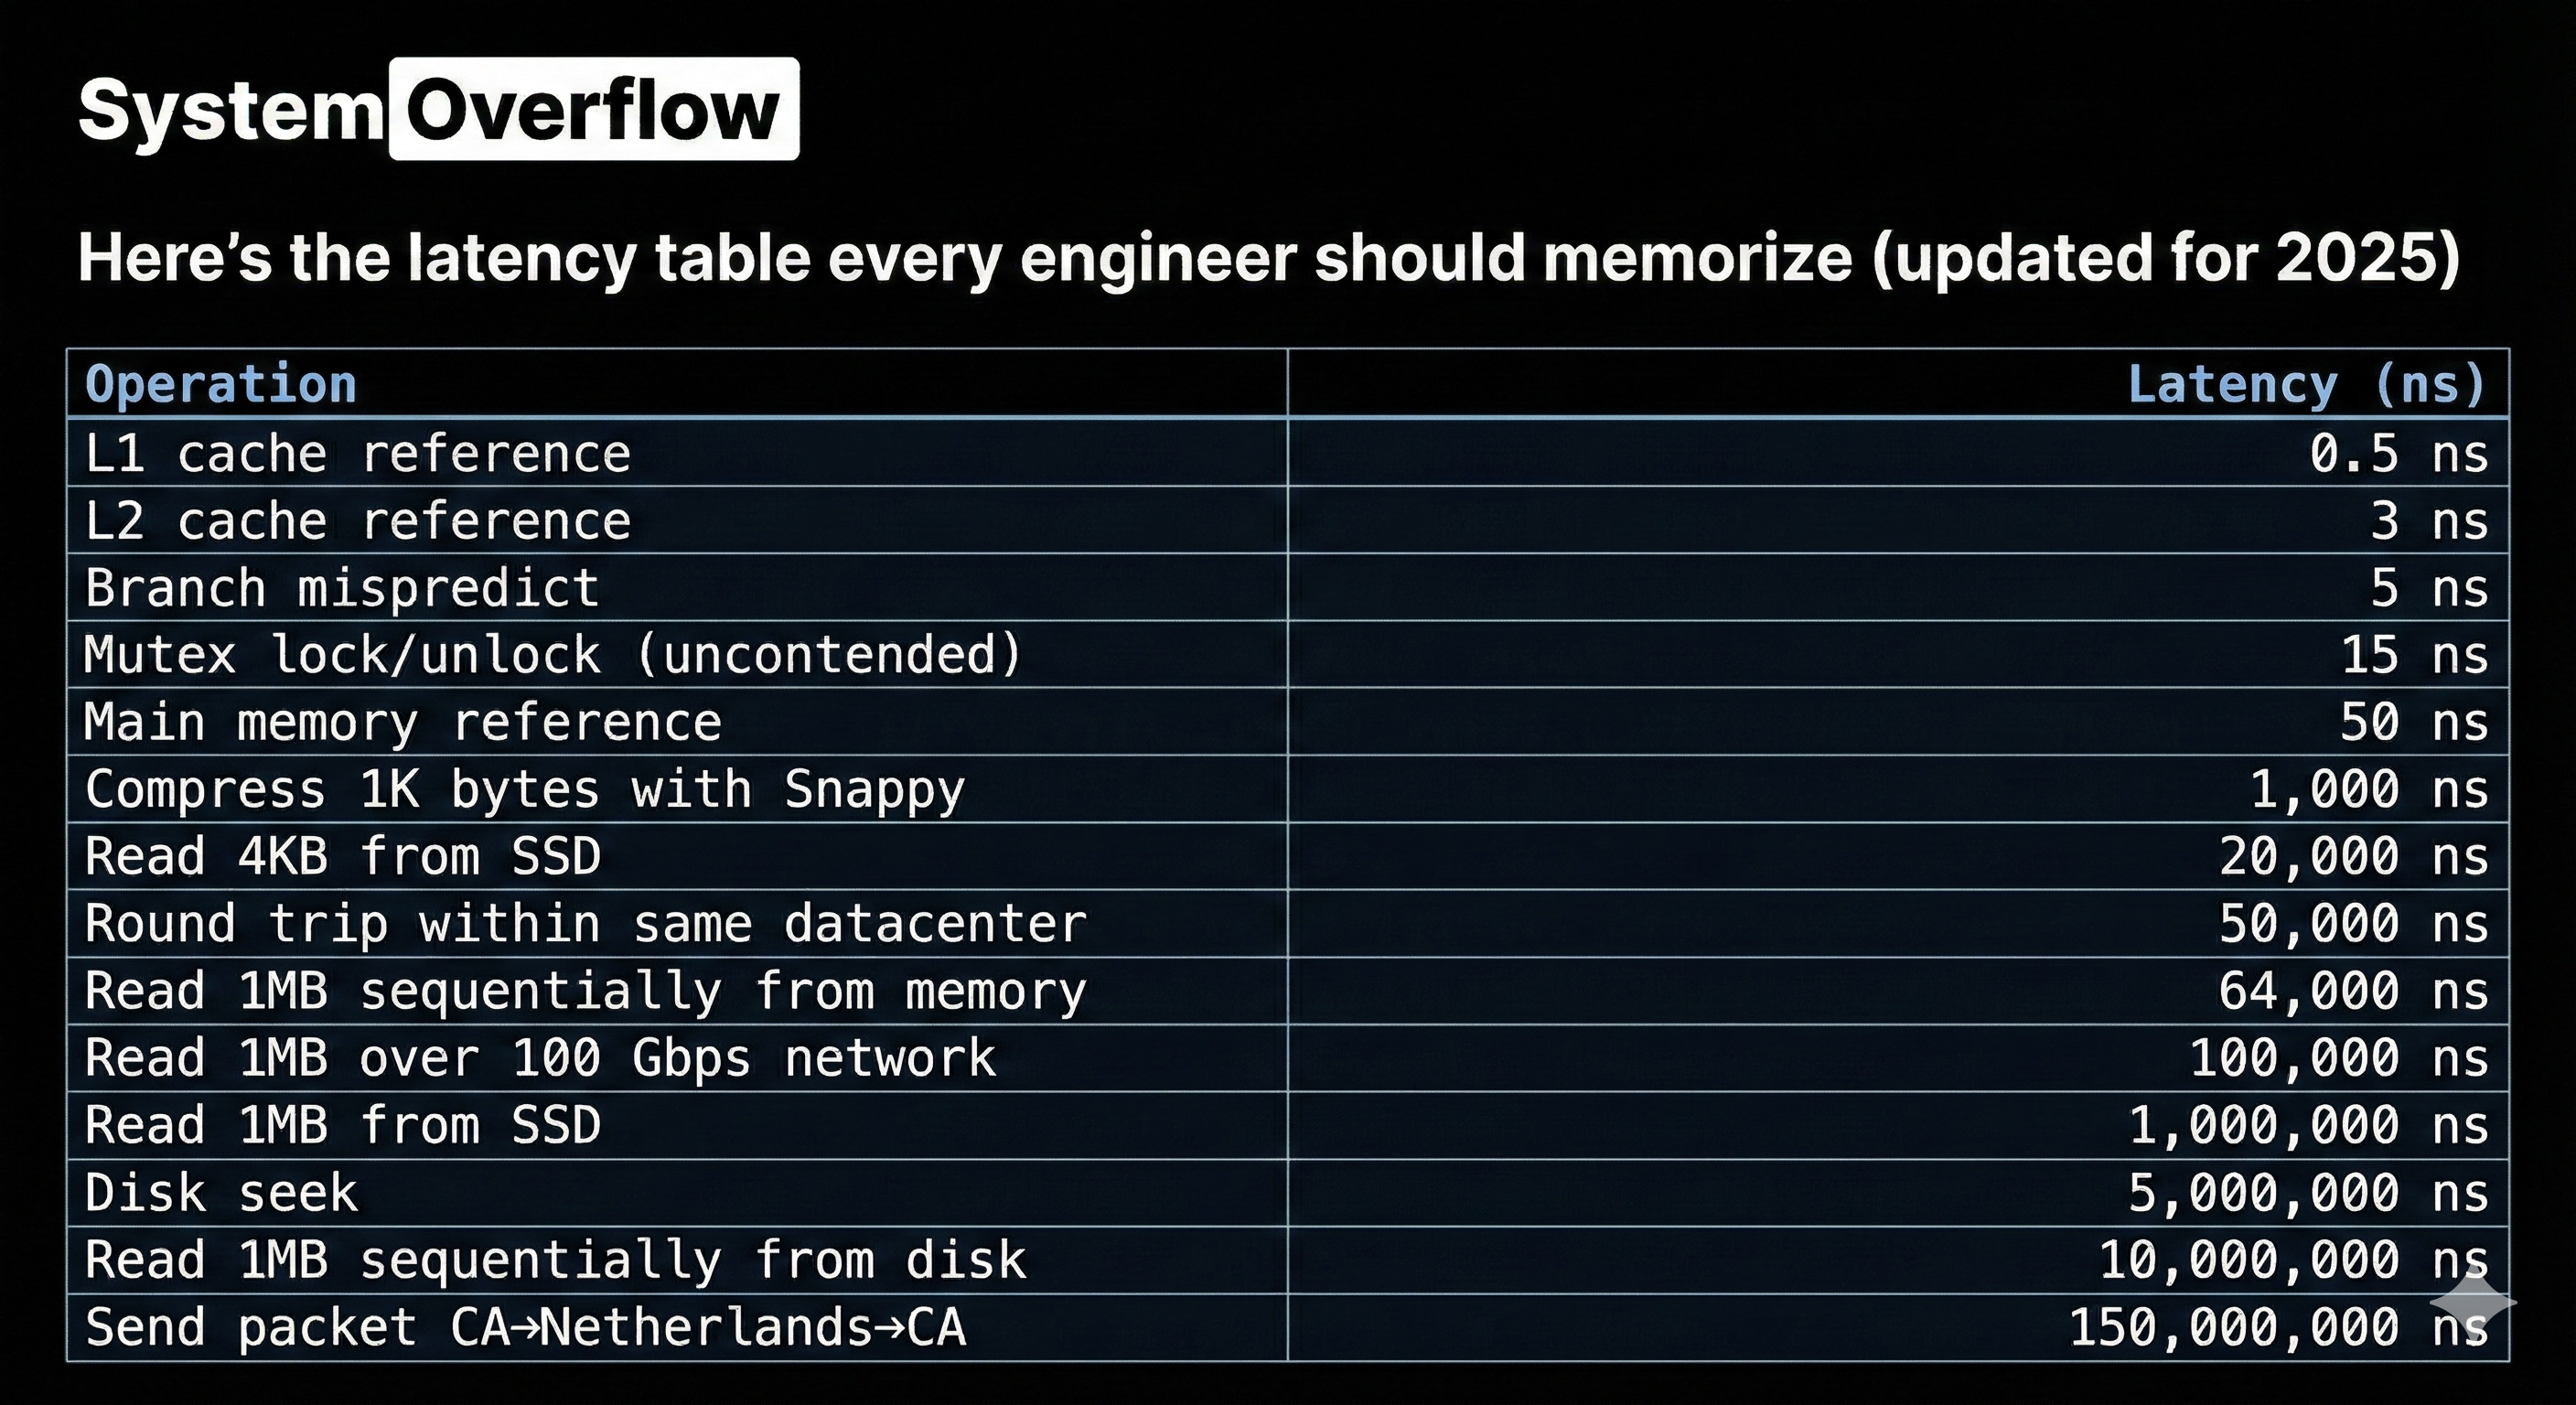
Back-of-the-Envelope Math Still Works
Here’s the latency table every engineer should memorize (updated for 2025):
Example: Quicksort a Billion Numbers
Let’s estimate sorting 1 billion 4-byte integers:
Memory bandwidth: 4GB × 30 passes ÷ 16GB/s = 7.5 seconds
Branch mispredictions: 30B comparisons × 50% mispredicted × 5ns = 75 seconds
Total: ~82.5 seconds (branch mispredictions dominate!)
Example: Generate Web Page with 30 Thumbnails
Serial reads from disk:
30 images × (5ms seek + 10ms transfer) = 450ms
Parallel reads across K disks:
Same work, latency drops by factor of K = ~15ms (with hundreds of disks)
Serial reads from SSD:
30 images × (20µs + 1ms) = ~30ms
This math takes 30 seconds but saves hours of implementation time.
Measurement: Your #1 Tool
Profiling Strategies
Start with pprof for high-level CPU profiling. Move to perf for hardware counter details.
Critical practices:
Build with optimizations + debug symbols
Write microbenchmarks for iteration speed
Emit performance counter readings for precision
Profile lock contention separately (can hide CPU bottlenecks)
When Profiles Are Flat
No obvious hotspot? Try this:
Many small wins compound - Twenty 1% improvements = 20% total gain
Look at loop call stacks - Restructure from the top down
Replace generality with specialization - Custom code beats generic libraries
Reduce allocations - Get heap profiles, target allocation count
Use hardware counters - Cache miss rates reveal hidden costs
API Design for Performance
Bulk Operations
Single-item APIs force expensive boundary crossings. Add bulk variants:
// Before
util::StatusOr<LiveTensor> Lookup(const TensorIdProto& id);

// After - 1000x less overhead
struct LookupKey {
  ClientHandle client;
  uint64 local_id;
};
bool LookupMany(absl::Span<const LookupKey> keys,
                absl::Span<tensorflow::Tensor> tensors);
Real impact: Reduced per-call overhead from milliseconds to microseconds.
View Types Over Copies
// Slow - forces copies
void ProcessData(const std::vector<int>& data);

// Fast - caller chooses container
void ProcessData(absl::Span<const int> data);
This lets callers use std::vector, absl::InlinedVector, arrays, or anything contiguous.
Thread-Compatible > Thread-Safe
Default to external synchronization. Internal locks are wasted overhead when callers already synchronize:
// Before - internal lock
TransferPhase HitlessTransferPhase::get() const {
  MonitoredMutexLock l(&mutex_);
  return phase_;
}

// After - caller synchronizes
TransferPhase HitlessTransferPhase::get() const {
  return phase_;
}
Result: 43 seconds → 2 seconds in production workload.
Algorithmic Wins
These are rare but devastating when found.
Example: O(N²) → O(N)
Before: Adding graph nodes/edges one at a time to cycle detector
After: Add entire graph in reverse post-order
Result: Cycle detection becomes trivial.
Example: Replace Sorted Intersection with Hash Table
// Before: O(N log N)
std::set_intersection(sources1.begin(), sources1.end(),
                      sources2.begin(), sources2.end());

// After: O(N)
absl::flat_hash_set<Node*> sources_set(sources1.begin(), sources1.end());
for (Node* src : sources2) {
  if (sources_set.contains(src)) { /* found common source */ }
}
Impact: 28.5s → 22.4s (21% improvement) on large compilations.
Memory Optimization
Compact Representations
Every byte matters at scale. Consider:
// Bad - 64 bits wasted per pointer on modern machines
std::vector<Node*> graph;

// Better - 32-bit indices if <4B nodes
std::vector<uint32_t> node_indices;
Node nodes[];  // Contiguous allocation
Benefits:
Smaller memory footprint
Better cache locality
Less allocator overhead
Inlined Storage for Small Collections
// Before - always heap allocates
std::vector<int> small_list;

// After - stack allocation for ≤N elements
absl::InlinedVector<int, 8> small_list;
No allocation overhead when size ≤ 8.
Arrays Instead of Maps
// Before
gtl::flat_map<int, int> payload_type_to_frequency;

// After - payload types are 0-127
struct PayloadTypeMap {
  int map[128];
};
Benchmark improvement: 26-31% faster access.
Bit Vectors for Dense Integer Sets
// Before
dense_hash_set<ZoneId> zones;  // Heavy allocation

// After
util::bitmap::InlinedBitVector<256> zones;  // Single allocation

bool ContainsZone(ZoneId zone) const {
  return zone < zones.size() && zones.get_bit(zone);
}
Results: 26-31% faster in real workloads.
Reducing Allocations
Every allocation has three costs:
Allocator CPU time
Initialization overhead
Cache line fragmentation
Avoid Needless Allocations
// Before - allocates every time
std::shared_ptr<DeviceInfo> dinfo =
    std::make_shared<DeviceInfo>();

// After - reuse static instance
static const std::shared_ptr<DeviceInfo>& empty_device_info() {
  static auto* result = new std::shared_ptr<DeviceInfo>(
      std::make_shared<DeviceInfo>());
  return *result;
}
21% throughput increase in production.
Reuse Temporaries
// Before - reallocates every iteration
for (const auto& item : items) {
  ResourceRecord record;  // ← Expensive!
  ProcessRecord(record);
}

// After - reuse allocation
ResourceRecord record;
for (const auto& item : items) {
  record.Clear();
  ProcessRecord(record);
}
Caveat: Reset periodically to prevent unbounded growth.
Reserve Container Capacity
// Before - multiple reallocations
std::vector<int> results;
for (int i = 0; i < n; ++i) {
  results.push_back(compute(i));
}

// After - single allocation
std::vector<int> results;
results.reserve(n);
for (int i = 0; i < n; ++i) {
  results.push_back(compute(i));
}
Avoiding Unnecessary Work
Fast Paths for Common Cases
Handle ASCII in UTF-8 parsing:
// Fast path - process 8 ASCII bytes at once
while ((src_limit - src >= 8) &&
       (((UNALIGNED_LOAD32(src) | UNALIGNED_LOAD32(src+4))
         & 0x80808080) == 0)) {
  src += 8;
}

// Handle trailing ASCII bytes
while (src < src_limit && Is7BitAscii(*src)) {
  src++;
}

// Fall back to state machine for non-ASCII
if (src < src_limit) {
  UTF8GenericScan(/*...*/);
}
Precompute Expensive Values
// Before - computed in every hot loop iteration
bool kernel_is_expensive = kernel->IsExpensive();
bool is_merge = IsMerge(node);
bool is_enter = IsEnter(node);

// After - computed once during initialization
struct NodeItem {
  bool kernel_is_expensive : 1;
  bool is_merge : 1;
  bool is_enter : 1;
  bool is_enter_exit_or_next_iter : 1;
};

// Hot path check
if (!item->is_enter_exit_or_next_iter) {
  // Fast path - no special handling needed
}
Defer Until Needed
// Before - always compute
HloSharding alt = user.sharding().GetSubSharding(/*...*/);
if (condition) { use(alt); }

// After - compute only when needed
if (condition) {
  HloSharding alt = user.sharding().GetSubSharding(/*...*/);
  use(alt);
}
Saved 43 seconds → 2 seconds by deferring expensive call.
Specialize Generic Code
Replace regex with simple operations when possible:
// Before
if (RE2::FullMatch(token, "prefix.*")) { /*...*/ }

// After
if (absl::StartsWith(token, "prefix")) { /*...*/ }
Or custom implementations for critical paths:
// Before - sprintf for IP address
StringPrintf("[%s]:%d", ip.ToString().c_str(), port);

// After - direct formatting
StrCat(a1, ".", a2, ".", a3, ".", a4, ":", port);
4x faster in monitoring hot paths.
Caching
// Cache based on fingerprint
uint64 fp = Fingerprint(proto);
{
  absl::MutexLock l(&cache_mu);
  auto it = cache.find(fp);
  if (it != cache.end()) {
    return it->second;  // Cache hit
  }
  // Parse and cache
  auto result = ParseProto(proto);
  cache[fp] = result;
  return result;
}
Help the Compiler
Compilers are smart but conservative. You can help:
Use Raw Pointers in Hot Loops
// Before - absl::Span has overhead
ForEachState(const Shape& s,
             absl::Span<const int64_t> base,
             absl::Span<const int64_t> count);

// After - raw pointers are faster
ForEachState(const Shape& s,
             const int64_t* const base,
             const int64_t* const count);
Hand-Unroll Critical Loops
// Before
while ((p + 4) <= e) {
  STEP;
}

// After - 16 bytes at a time
while ((e - p) >= 16) {
  STEP; STEP; STEP; STEP;
}
while ((p + 4) <= e) {
  STEP;
}
Replace FATAL with DCHECK
// Before - forces frame setup
default:
  ABSL_LOG(FATAL) << "Invalid tag";
  return sizeof(DynamicNode);

// After - compiles away in optimized builds
default:
  ABSL_DCHECK(false) << "Invalid tag";
  return sizeof(DynamicNode);
Eliminates frame setup costs in release builds.
Reduce Stats Collection
Balance utility vs. cost:
Sample, Don’t Measure Everything
// Before - update 39 histograms per request
UpdateHistograms(request);

// After - sample 1 in 32 requests
if (request_count % 32 == 0) {
  UpdateHistograms(request);
}
Google Meet used this during COVID surge to handle traffic spikes.
Drop Unused Stats
// Removed expensive alarm/closure counting
// that nobody looked at
// Result: 771ns → 271ns per alarm
Precompute Logging Decisions
// Before - checked every iteration
for (int i = 0; i < 1000000; ++i) {
  if (VLOG_IS_ON(3)) {
    VLOG(3) << "Processing " << i;
  }
}

// After - check once
const bool vlog_3 = VLOG_IS_ON(3);
for (int i = 0; i < 1000000; ++i) {
  if (vlog_3) {
    VLOG(3) << "Processing " << i;
  }
}
Results: 8-10% improvement on compute-heavy loops.
When to Optimize
Not all code deserves the same scrutiny:
Test code: Optimize asymptotic complexity only
Application code: Focus on request handling, not initialization
Library code: Assume worst case—it’ll end up on hot paths
Infrastructure code: Every nanosecond multiplies across thousands of servers
Code Size Matters Too
Large binaries mean:
Longer compile/link times
More memory pressure
Worse instruction cache behavior
Harder deployment
Sometimes smaller, simpler code is faster despite being “less optimized.”
The Meta-Lesson
Jeff and Sanjay’s guide isn’t about premature optimization. It’s about informed decision-making:
Understand the cost model of your system
Make the fast choice when it’s equally simple
Measure before complex optimizations
Think in orders of magnitude, not percentages
Compound small wins into big gains
Most importantly: Don’t wait for performance problems to think about performance. Build it right from the start, and save yourself from the architectural debt that’s nearly impossible to pay off later.
Want more deep dives on systems engineering? Follow System Overflow for weekly breakdowns of distributed systems, databases, and infrastructure engineering.
Further Reading: