
How Meta Built DrP: Automated Root Cause Analysis at Scale
Building a scalable investigation platform that codifies tribal knowledge into automated playbooks, reducing MTTR through programmable workflows and ML-powered analysis.

When an alert fires at 3 AM, your on-call engineer faces a daunting task. They need to check dozens of metrics, correlate events across systems, identify which dependency failed, and determine root cause before escalating further. At Meta’s scale, running 50,000 automated analyses daily across 300+ teams, this manual process doesn’t just cause engineer burnout. It directly impacts system availability.
Meta built DrP to solve this exact problem. Over five years in production, processing 1.5 million analyzer runs and 250K alerts every 30 days, DrP has reduced mean time to resolve (MTTR) by 20% on average. Teams that comprehensively adopted the platform achieved 50-80% reductions. But DrP isn’t just about automation. It’s a case study in how to capture tribal knowledge, build extensible investigation workflows, and create a system that compounds value as more teams adopt it.
You’ll learn how Meta approached the core challenges of automated incident investigation: building an expressive SDK for diverse investigation patterns, scaling execution to handle thousands of concurrent analyses, and integrating seamlessly into existing workflows.
The Challenge: Investigation Workflows That Don’t Scale
Meta’s infrastructure spans thousands of services with complex dependencies. When a metric degrades, the investigation typically follows a decision tree. Is it a configuration change? Did a dependency fail? Is it isolated to one region? Traditional approaches fail at this scale for three reasons.
First, playbooks become outdated immediately. Engineers document investigation steps in wikis or runbooks, but these grow stale as systems evolve. A service that used to call three dependencies now calls twelve. The configuration format changed. By the time the next incident hits, your carefully documented playbook leads to dead ends.
Second, ad-hoc scripts don’t compose. Individual teams write Python scripts or SQL queries to automate parts of their investigations. But these scripts are point solutions. They hardcode assumptions about data locations, assume specific metric names, and can’t be chained together. When you need to investigate a dependency’s dependency, you’re back to manual work.
At scale, the real problem isn’t any single incident. It’s the combinatorial explosion of investigation paths across hundreds of services.
Think of it like a choose-your-own-adventure book where every page is written by a different author using a different language. You can’t jump between chapters. Each investigation starts from scratch.
Third, tribal knowledge remains locked in engineers’ heads. Your senior engineer knows that when metric X drops, you should check configuration Y in region Z. But that knowledge disappears when they’re on vacation or leave the team. New on-call engineers spend hours rediscovering patterns that experts recognize instantly.
Meta’s Solution Architecture
DrP addresses these challenges through a platform approach rather than a tool approach. Instead of replacing human investigation, it provides infrastructure to capture, scale, and automate investigation workflows.
The SDK: Codifying Investigation Logic
At the core is DrP’s SDK, which lets engineers author analyzers (automated investigation playbooks) in Python or PHP. The SDK provides a Context class, a key-value dictionary for storing investigation parameters like alert ID, service name, threshold violations, and telemetry data locations. Input APIs capture and validate these parameters, while any inferred values can be dynamically added during execution.
Critically, DrP provides declarative, strongly typed APIs to query data sources including time series databases, analytical databases, data warehouses, and log databases. Instead of writing raw SQL strings that are difficult to maintain and debug, engineers use type-safe APIs tailored to common investigation patterns. This eliminates hardcoded queries and enables easy reuse across analyzers.
After analysis completes, outputs are captured in a structured Findings class that supports flexible rendering and evidence inclusion. Findings can output plain text or machine-readable formats including Thrift payloads with self-describing schemas. These structures facilitate metadata addition for standardized UI widgets and custom React components, enabling downstream processing and analytics.
Analysis Libraries: Scaling Investigation Intelligence
Services generate massive amounts of observability data. DrP includes scalable analysis algorithms based on statistical and ML techniques:
Dimensional analysis helps isolate issues across multiple dimensions (region, endpoint, cluster). For the most frequent repeated investigations, a pre-aggregation layer can reduce dataset size by up to 500X, significantly speeding up real-time, latency-sensitive investigations.
ML-based event isolation addresses a common cause of incidents: code changes and config deployments. The library ranks thousands of code and config change events using signals like text matching, time correlation with alerts, and on-call context. On average, this filters out the majority of uninteresting events, surfacing the most suspicious ones with confidence annotations explaining the ranking.
Time series correlation helps identify relationships between metrics across different services and data sources.
The analysis libraries provide both rule-based and ML-based techniques, but pure ML systems have limitations in data quality and customization. Meta learned that combining rule-based suggestions from community expertise with AI, augmented by dashboards for visualization, works better than purely automated approaches.
Analyzer Chaining: Composing Investigations
Services depend on other services. When investigating a frontend issue, you often need to check if backend dependencies are healthy. DrP solves this with analyzer chaining, allowing analyzers to call other analyzers in a sequence or DAG (Directed Acyclic Graph).
Key capabilities include: passing inputs and context to dependent analyzers with temporary overrides for additional parameters; flexible outputs via the Findings class that calling analyzers can parse for relevant information; and lazy import of analyzers for dynamic chaining without upfront latency. Cross-platform support allows chaining between PHP and Python analyzers.
This promotes analyzer reuse, with over 21% of analyzers using chaining. Using lines of code as a measure, analyzer chaining provides 3x improvement for typical service debugging use cases. Power users report 5-10x faster development after migrating from ad-hoc solutions.
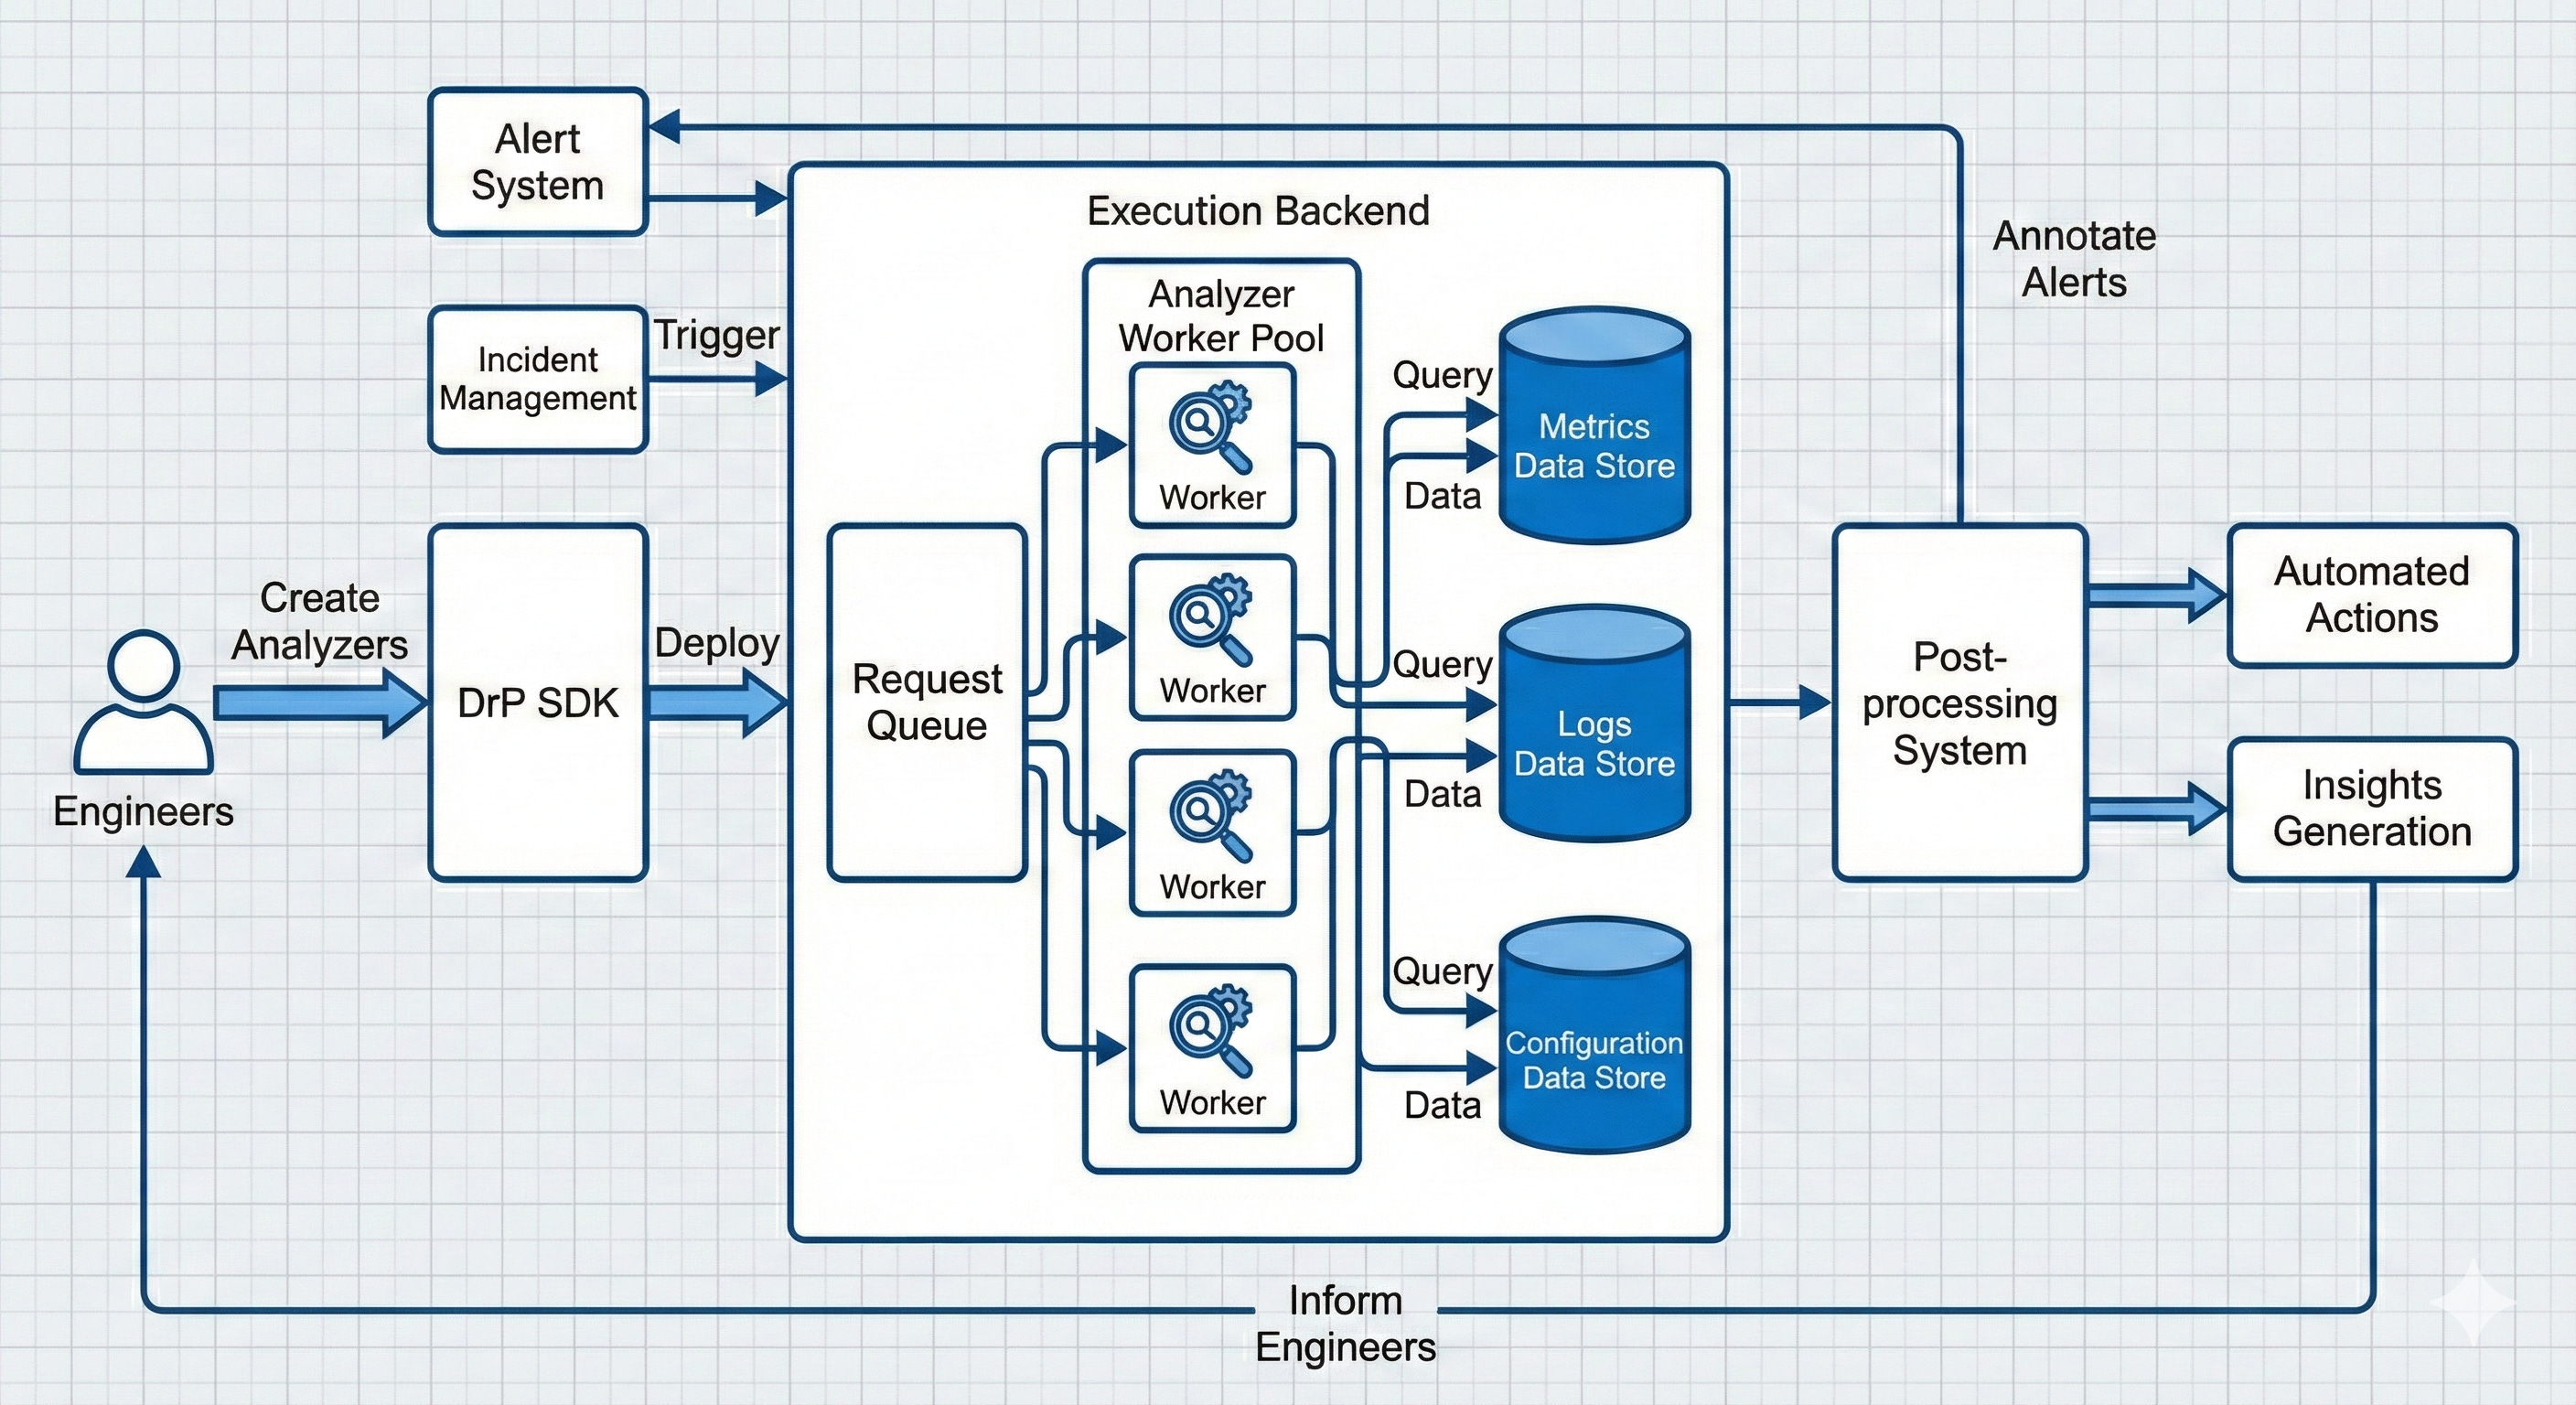
The Scalable Backend
DrP maintains 99.9% backend availability while processing massive scale. The backend uses a MySQL-backed queue store with fields for request ID, timestamp, analyzer identifier, context, and status. Worker tiers run executors that parse requests and run analyzers in sandbox environments, with results returning asynchronously via callbacks.
A key challenge: with 2000+ analyzers constantly in churn, packaging all into one binary increases size and load time, and creates noisy neighbor issues where one analyzer failure affects others. Instead, DrP creates smaller analyzer groups based on expected affinity, each with its own binary.
When a request arrives, the system identifies the analyzer group, dynamically fetches the binary, and launches it as a subprocess. Since 85% of traffic comes from the top 10% of analyzers, those binaries are pre-loaded at startup while others are lazy-loaded. For the most frequently used analyzers, they’re embedded directly in the executor binary for negligible overhead. This provides a balance of quick startup and acceptable delays for dynamic fetching.
Workflow Integration: Bringing Analysis to Engineers
DrP integrates directly into Meta’s alerting and incident management systems. When an alert triggers, it auto-executes associated analyzers without engineer intervention. Investigation results appear immediately on the alert page, providing context before the on-call engineer even acknowledges the page. The process from alert to analysis output typically takes a few minutes, providing near real-time analysis.
This integration is crucial. If engineers need to log into a separate system, select an analyzer, and wait for results, adoption suffers. By embedding DrP into existing workflows, Meta ensures the path of least resistance is using automated investigation. Additionally, a standalone UI and CLI are available for ad-hoc investigations, used by over 450 unique users per week.
Post-Processing: Closing the Loop
After analysis completes, DrP’s post-processing tier executes automated actions based on results: creating incident tickets with pre-filled context, generating PRs to fix configuration drift, annotating alerts with likely root causes, or triggering remediation workflows.
The DrP Insights system periodically analyzes historical analyzer outputs to identify and rank top alert causes, helping teams prioritize reliability improvements. Instead of just reacting to individual incidents, teams can see aggregated patterns and invest in fixing root causes.
Quality Assurance: The Backtesting Framework
Testing analyzers is challenging. There’s no good way to record past incidents, and unit tests miss coverage due to dynamic investigation paths. Meta developed a novel backtesting mechanism: they retain inputs and outputs from past analyses (default 30 days), enabling integration tests on historical data for modified analyzers.
These tests filter out non-logic errors, highlighting actual code change issues. Automated in the PR review process, they block PRs until errors are fixed. Combined with canary testing that runs a sample of production traffic before deployment, this has greatly improved analyzer quality and prevented deployment of buggy analyzers.
Trade-offs and Lessons Learned
Assist versus full automation: Meta initially aimed for complete automation but pivoted to an assistive approach. Statistical and ML analysis have limitations and produce false positives. Engineers don’t always trust fully automated systems. And keeping analyzers updated with evolving systems is difficult. DrP now offers insights and recommendations that engineers validate, balancing automation with human expertise.
Adoption depth matters more than usage. Teams with fewer than 5 analyzers see 10-15% MTTR improvement. Teams with 10+ analyzers consistently achieve 50-80% reductions. One team reduced MTTR from 771 hours to 139 hours (82% improvement) after building 136 analyzers.
Data quality is everything: Seamless investigation requires quality data and metadata in telemetry systems. Meta faced issues correlating data from different sources and lacked structured metadata for service dependencies or data lineage, limiting downstream correlations.
Community-driven development: DrP’s success came from democratizing analyzer development. The team bootstrapped adoption by building analyzers for common investigations (services infrastructure, hardware), then developed the SDK for teams to build custom analyzers and chain them together. The engaged community effort was essential for scaling across 300+ teams.
Analyzer maintenance: Like any software, analyzers need long-term maintenance. Teams need to estimate the right time to invest. If investigations are simple and repetitive, dashboards may be more effective. As complexity and team size grow, analyzers add more value.
System Design Patterns Worth Noting
DrP demonstrates several architectural patterns that appear frequently in system design:
Workflow orchestration with DAGs: The analyzer chaining model mirrors how systems like Airflow or Temporal handle complex workflows. Each analyzer is a node that can invoke dependencies, pass context, and aggregate results. This pattern appears whenever you need to coordinate multi-step processes with dependencies.
Queue-based async processing: The MySQL-backed queue with worker pools is a classic pattern for handling variable load. Requests are decoupled from execution, allowing the system to handle bursts (like widespread incidents triggering hundreds of alerts) without blocking callers.
Lazy loading for scale: Pre-loading the top 10% of analyzers that handle 85% of traffic while lazy-loading the rest is a practical application of the Pareto principle. This pattern applies to any system with skewed access patterns, from CDN caching to database connection pools.
Structured output contracts: The Findings class with Thrift schemas enables loose coupling between analyzers and consumers (UIs, post-processors, other analyzers). This is the same principle behind API contracts and schema registries in event-driven architectures.
Based on Meta Engineering blog: DrP: Meta’s Root Cause Analysis Platform at Scale
Master system design concepts @ System Overflow